
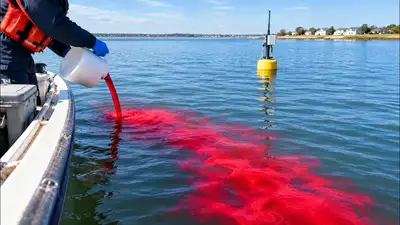
Representative image of red dye released into coastal bay waters to trace treated wastewater flow and help protect shellfish habitats, beaches, and bay wildlife. Image Credits: ChatGPT.
For a few hours in March 2024, parts of the Patchogue River and Patchogue Bay on Long Island could take on an unusual red or pink appearance. Because the surrounding waters are used for shellfish production, and water movement affects how quickly pollutants would spread in the event of a spill or dumping, this question matters. Because it can be detected at very low concentrations, the selection of Rhodamine WT dye was significant.
The colour was not caused by pollution or an algal bloom. Scientists had deliberately added a fluorescent dye to treated wastewater, creating a visible tracer that could reveal where the water travelled after leaving a treatment plant. This experiment aimed to answer a practical question: what happens to treated wastewater that enters the Patchogue River and Bay? The experiment was based on a simple idea: once researchers know when and where the dye is injected, they can trace its path. Using equipment and monitoring stations, they measured the levels of the dye as it flowed from the river to the bay. The DEC assured people that the amount to be used would not pose any threat to the environment.
The hydrographic dye study was conducted jointly with the US Food and Drug Administration between March 24 and 30, 2024, according to the New York State Department of Environmental Conservation (DEC) . Low concentrations of Rhodamine WT, a water-tracing dye approved by the US Environmental Protection Agency, were introduced into wastewater at the Village of Patchogue Wastewater Treatment Plant on March 25 for about 12.4 hours. As a result, the experiment became a way to track wastewater movement through the bay.
The dye was expected to make sections of the Patchogue River and Patchogue Bay appear red or pink temporarily. The purpose was not to test whether the wastewater itself was safe. Instead, researchers wanted to understand its flow and dispersion after discharge. That information could help DEC and the FDA determine the appropriate shellfish closure area around the treatment plant’s outfall. A US Geological Survey investigation examined groundwater, stormwater, ponds, wetlands, marinas and the wastewater treatment plant as possible contributors to faecal contamination. It found that stormwater and drainage from ponds and wetlands were the most substantial transport mechanisms identified in Patchogue Bay, while the treatment plant was not considered a likely major source of faecal contamination based on the study’s microbial-marker results. That distinction is important. Tracking treated wastewater does not mean that all contamination found in the bay originates from the treatment plant. Instead, the dye study was intended to establish how this particular discharge moves through the water system, providing information that can be considered alongside other identified contamination pathways when assessing conditions in the bay. The information gathered may help define the boundaries of the wastewater discharge area where shellfish harvesting is prohibited. It could also serve as a reference point for future incidents. Additionally, a study in Estuaries and Coasts found that circulation and flushing in the larger Great South Bay can vary greatly depending on tides, wind and inlet configuration. These factors influence the time that water stays in different areas of the estuary. That is why Patchogue used a real tracer: computer models can estimate circulation, but the dye provides a field-based comparison. For scientists, the temporary colour change was a way to trace the water’s path and gather data for managing shellfish waters.
The study also built upon earlier research showing that Patchogue Bay is influenced by several different potential sources of contamination.
Scientists used a fluorescent dye to trace treated wastewater in the Patchogue River and Bay. This experiment helped understand water movement and its impact on shellfish production areas. Image Credits: Wikimedia Commons.