
You research cartography. Are there maps involving animals — or is this entirely human?
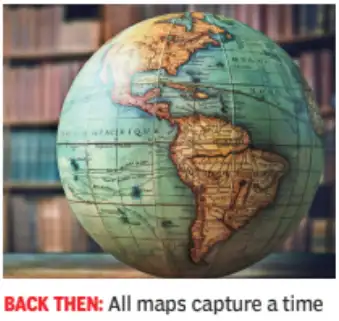
I haven’t yet seen a map which has an animal’s perspective — that would be at the frontier of cartography and zoological studies. What we do have now is human-made, computer-aided cartography which shows animal migrations in great detail. With the tagging of wild species, we can reconstruct — even for whales, which travel thousands of miles underwater — long-term migrations. With that data, we see extremely beautiful and distinctive patterns for every kind of animal in terms of scale and rhythm. It might seem at first glance that a map is basically like a snapshot — yet, a snapshot is a historical document. Every map tells time as it records the data available and understood in the landscape and moment the cartographer was charting. Even ‘enduring’ things are not permanent — mountains move, shorelines alter, rivers change course. Elements of our physical geography change over time — that shows when we study different maps of the same terrain. The GIS maps most of us use are on our phones and computers. These are imbricated in time in different ways and registers. Consider real-time traffic along routes, which is time data, existing on the surface of this sphere. Below this is a layer showing which businesses are open at a given time — this data, which is a snapshot of the economy, also keeps changing. Broadly speaking, the entire project of representing the globe through this abstract system of coordinates is itself inseparable from our notions of being able to measure space and time together — all measurements of the planet, over centuries, have been taken with reference to astronomy. It is impossible to disentangle the measurement of space from time — to capture longitude, ship captains had to have clocks. Our entire mapping apparatus is dependent on having developed a sophisticated conceptual understanding and technological engineering for measuring time.
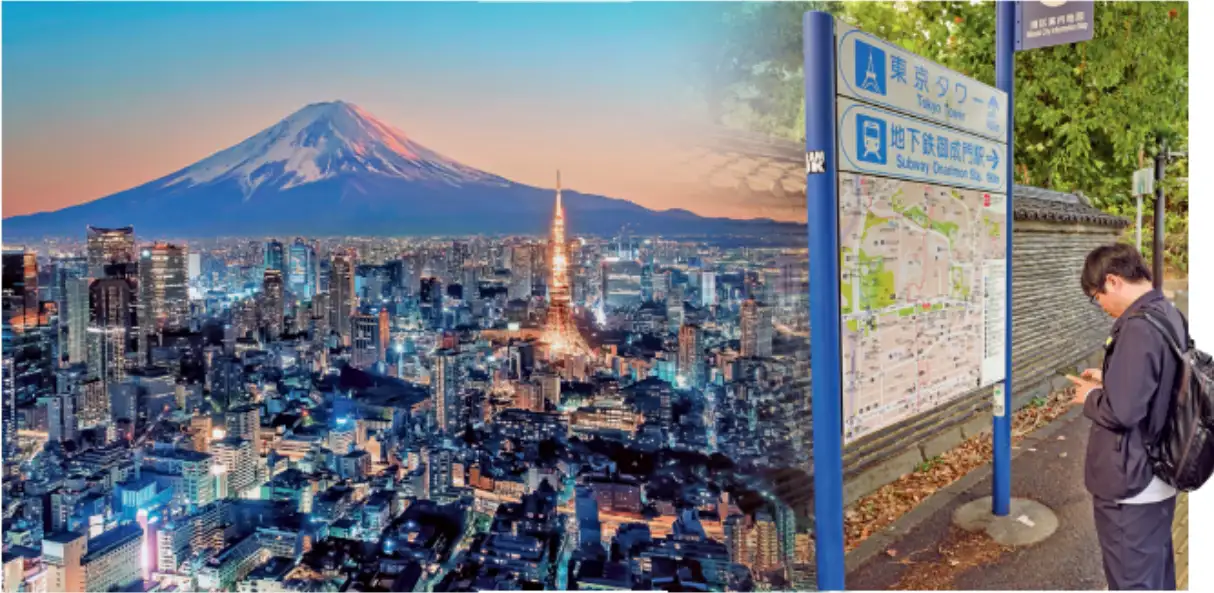
I credit Mary Elizabeth Berry at the University of California, Berkeley, for drawing attention to this — she trained initially to work on the late medieval period in Japan, the civil war era of the 15 th and 16 th centuries. She then crossed a big rupture in Japanese history — 1603 — when the Japanese archipelago was decisively unified by the Tokugawa shogunate. Researching the 17 th and 18 th centuries, Berry saw an enormous amount of printing had taken place. There is a level of literacy required to make a map legible and enjoyable — an ancient map, full of beauty, can also show us the pilgrimage routes taken by a Chinese monk in the 7 th century who went to India to see the homeland of the Buddha and bring back sutras.
Suddenly, there was a government in place which presumed the right to collect data about its population, landscape and productivity. A stable centre was affirming its ability to ask local lords for information. Someone reading this could suddenly see the Himalaya mountains, the Silk Route winding through inner Asia, the birthplace of the Buddha, ancient Sri Lanka down in the corner, etc. This is a journey of discovery — it deepens our learning and appreciation. The more maps we read, the more pleasure and education we get from the world.
I’ve been teaching a course at Stanford where I introduce students to the dazzling variety of maps in world history, from Jain and Buddhist maps to early Christian ones, cosmological diagrams, moral and poetic maps and roadmaps from earlier times.